Modern cameras make much use of technology, for exposure measurement they use the 18% grey scale method. This method assumes that regardless of what you are metering in your viewfinder that it must equivocate to 18% grey scale; this is the technological equivalent of a bell curve. Camera in automatic or programmed mode also have a set of pre-programmed scenes from which to closely approximate your scene and to customize your exposure, but this may not be always what you want. In order to get this you need to be able to adjust your cameras settings (i.e. aperture/shutter speed/ISO) but also to read your histogram to see when you are getting a properly exposed frame for best quality.
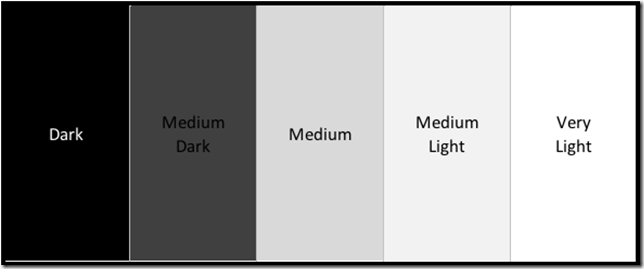
The Histogram is probably the greatest advent of modern digital photography in conjunction with the screen on the back of your camera. The Histogram is a modern day light meter and can instantly tell you how much light is reaching the sensor of you camera from the actual recorded image. Though it may first appear difficult to understand, it is not. The histogram is a measure of light reaching the camera across the spectrum from dark to light with dark being on the left hand side and light on the right, the midrange (18% grey) is of course the middle with 2 other intermediate shades medium-dark and medium-light on either side of the 18% grey in the middle.
For those of you who use virtually any image processing software (Photoshop, Aperture, Lightroom), you will also see the Histogram in your software package; in some packages on the Histogram and especially adjustment dialog boxes you will notice a range of 0 (zero) to 255. at the bottom of the dialog box. this actually represents the range of exposure similar to the Histogram with zero being on the left and 255 being on the right. Each of the 5 distinct segments in the graph above represent 55 1/5 increments of difference in its range. For the purpose of this article I’ve used the histogram from Apple’s Aperture image processing software to accompany the photographs I’ve used to demonstrate range.Despite progress in technology, human interpretation still very much required. At times you may see a scene that has a one sided graph either dark (left) or light (right) but as the artist you must assess your scene and see if this is the interpretation of the scene you are shooting that you wish to portray. For instance shooting a beach scene or sunrise may not have much of the dark element in it and the histogram will either be towards the middle or of a lot of the sky in in the frame even gravitated towards the right of the graph. On the other hand night photography will not have much of the light element and the histogram will gravitate towards the left. Now that you know these basics the other important element to know is that, when your histogram displays a flat line at the top of the graph that means you have exceeded the range of the sensor and will have some clipping.
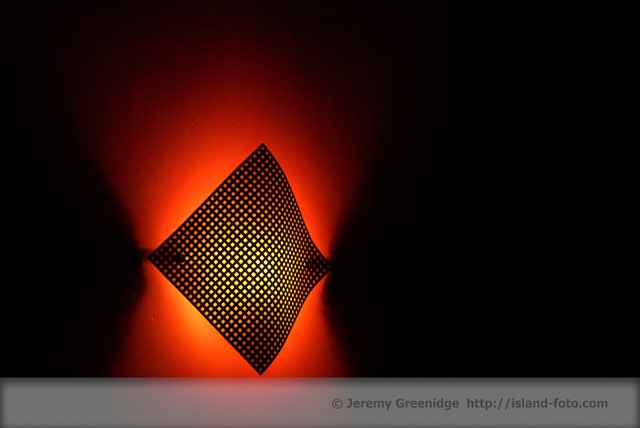
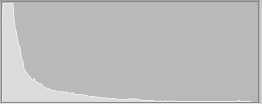
You will notice in this picture of a light fixture on a wall that the Histogram is seems to be rather one sided despite the bright splash of color that is shown, those of us who have operated in a black and white darkroom would instantly be clued in on this as the red color, similar to a darkroom safelight, is in a range that although visible to the human eye the red light is of a wavelength that is not super sensitive to photographic mediums, hence the rendering of the graph as it did. You will also notice in this photograph that along with that the flat line at the top which indicates that you have exceeded the range of the camera, this may happen to you from time to time as you explore the possibilities of shooting with your histogram as an exposure guide. My intent here was to show the wall totally dark except for the single splash of red light without any bleed from the same. There is a declining measurement of exposure as the graph moves towards the very light range of the histogram hence it tapers off progressively as it approaches this range.
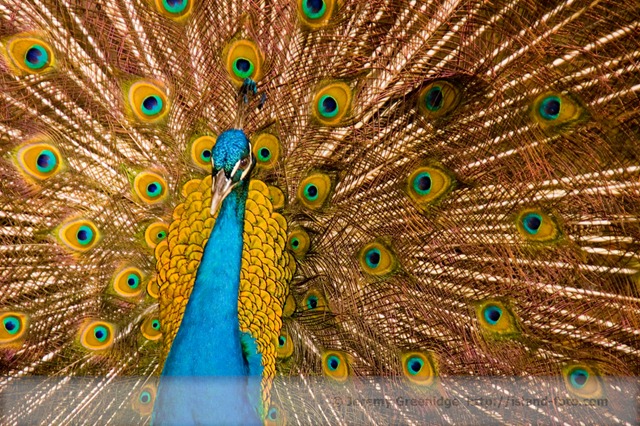
The histogram of picture of the Peacock appears to be a bit muted because of the predominance of brown in the image but you’ll notice that in actuality the blue is quite brilliant. This image does not fully fill up the frame because the peacock is not an inanimate object so getting a very quick capture without the iridescence of the flash causing a bounce back of light was tantamount. As you’ll realize that different colors will show in different spectrum’s of the histogram keep this in mind when you start to use your histogram.
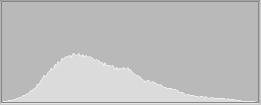
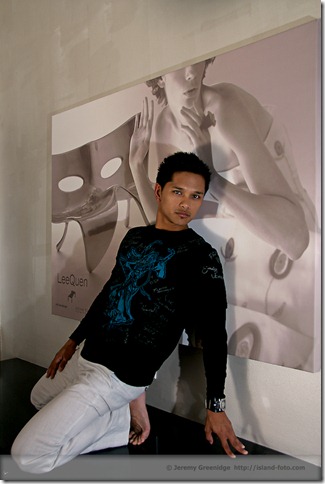
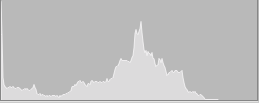
On viewing this image, shot at the Hotel Diva in San Francisco, you’ll see the subject is wearing a black shirt which causes some register on in the dark spectrum but the image is dominated primarily by 18% grey or something very close to it, this cause the middle of the histogram to peak and be the predominant spectrum registered on the graph.
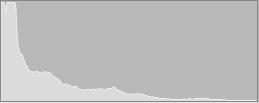
Shot hand-held in a darkened theater at Disney’s Animal Kingdom, naturally this would be on the dark side of the spectrum even though glimmers of white show up the exposure is dominate by darker areas
Here is an image dominated by the lighter side of the spectrum with the white walls to the point where some clipping does occur, you loose detail in the clipping but my intent was not to capture detail in the wall it was to capture detail of the scene, do take note that their is a sliver of activity in the black representing the jeans and black shirt worn by one of the models.
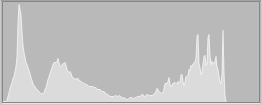
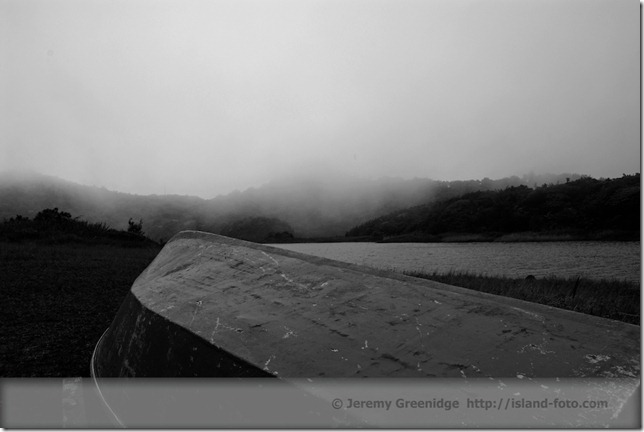
This picture of an overturned boat was taken at a mountain top lake in the Nature Isle of the Caribbean Dominica. From the image you’ll notice that you have very dark areas of the image and some light images but nothing that is very light, this is very much reflected in the histogram with peaks in the very darks, the dark and the light areas and very little in the 18% grey area.
What you’ll realize is that there is NO set way that your histogram should look it changes from scene to scene so you should have an idea of what to expect in your histogram even before you shoot your scene. Knowing all this you’ll realize that the histogram should be used to check exposure while the display of the actual image should be used check composition and also if you are using flash to ensure that you have not created shadows that you did not intend to, however, at no time should it be used to evaluate exposure. The register of light on your cameras display can vary depending on how brightly you have your monitor set or even ambient light conditions. If you aren’t going to shoot today take some time to evaluate your past images and view the histograms for them and see if you could have made improvement in their exposure. I recommend (if you can) downloading the images from your camera but not deleting the card and then view the images histogram in your image editing software while comparing it to the histogram on your camera to ensure that they register similarly.
Happy shooting and remember to check those histograms!!!




Trackbacks/Pingbacks